Release Notes 6.3 - Corporate Performance Analytics

In this new release of CXO the focus is on financial information as one of the many pillars required to provide truly in-depth analytics and insight. In a competitive landscape companies need more than just accurate financial statements and reports. You need predictive analytics in order to make effective decisions with limited information and time.
CXO-Cockpit, the Corporate Performance Analytics platform gives you a full overview of the current financial figures and non-financial data, together with forecasting capabilities. In the new release there are new features such as; Prediction, Drill on Columns and many more.
Predictive Analytics
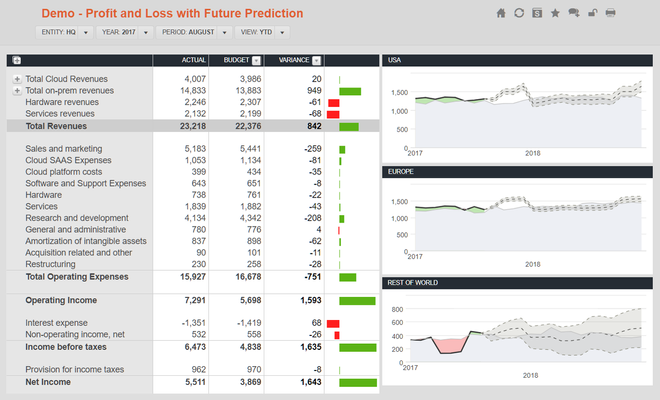
PredictionMake better decisions driven by automated forecast modeling. Merging predictive analytics with traditional data can make you stand out from the competitors. Foresee trends, focus on the data that actually matters and provide the CFO and CEO with the ability to forecast the company’s overall direction. Plan ahead and help the business move forward! How to create a report with this new feature can easily done by a report creator or admin. |
|
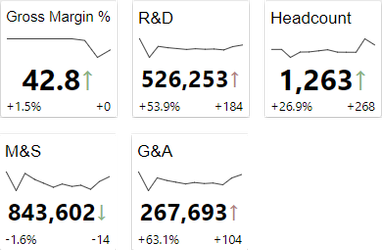
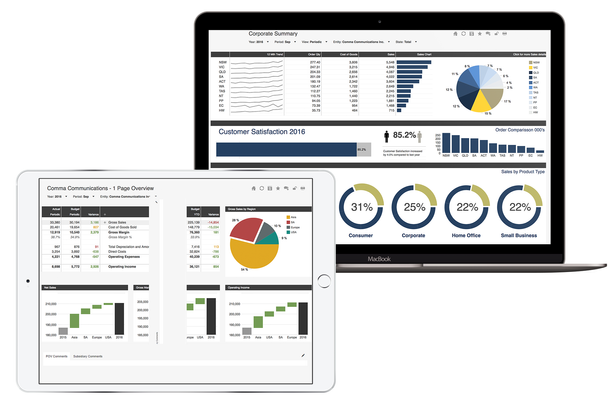
Performance TilesGain a broader perspective and overview with the new CXO-Cockpit Performance Tiles. Have all Key Performance Indicators in a single overview for the quickest analysis and easiest comparison. It is also possible to use a Tile for storytelling to guide and navigate to a different report by clicking on the Tiles. |
|
Drill down on ColumnsThe drill on the row lists (see Gross Sales in this example) is a well known feature. Since the release of our latest version 6.3 it is possible to dive even deeper by expanding your multi-column horizontally and being able to view all the sub-section information. Find deeper insights and understand what makes up the figures. All the drill options can give the end user lots of flexibility and analyze capabilities. | 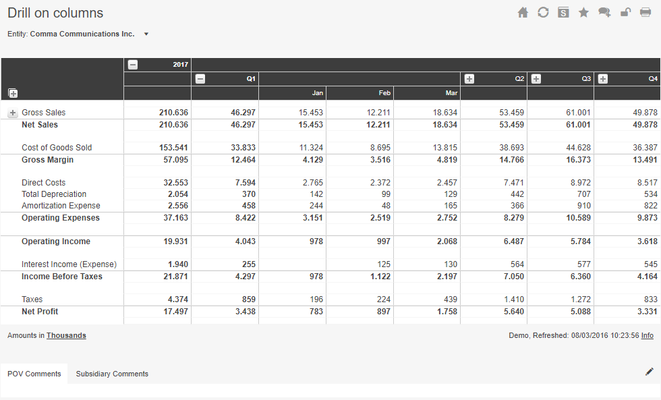 |
Options for report building enhanced
Enhanced Multi Source SupportCXO is continuously improving and supporting the use of multiple sources within the reporting suite. With release 6.3 we have added new multi source "out-of-the-box" reports, we have also expanded the methods by which you can extract data into CXO-Cockpit. The value tree control and the bridge control are now available for multi source reporting. |
|
Dynamic Report TitlesDynamic Labels tells exactly what the user is looking at and automatically change as you work. The text is generated by an expression which uses the short name of the desired dimension. With this feature each report still has its unique name. However the title shown can be the same as other report titles via this dynamic title functionality. | 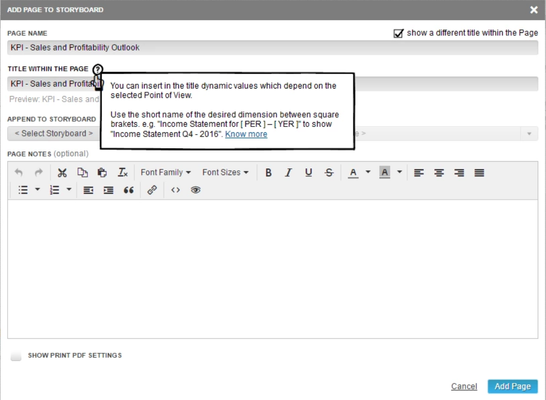 |
Column Drop Down SelectorGet more flexibility by grouping columns. The column selector helps to keep things uncluttered while still providing powerful reports. | 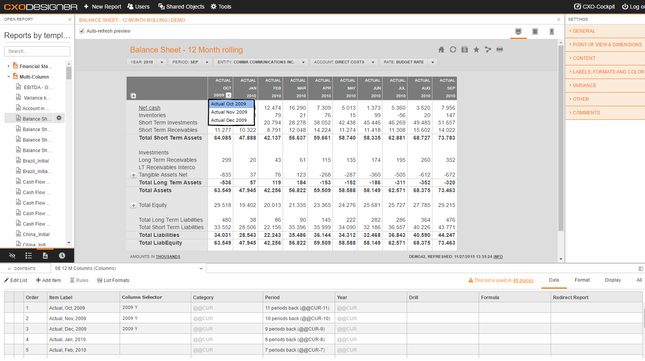 |
Responsiveness for Free Format ReportsCXO-Cockpit now automatically adjusts the height and position of the free format report tables, objects and charts. Ensuring the best user experience regardless of the device or screen size used. When drilling in an upper table, the table grows larger without displaying a scrollbar and the objects below move downwards accordingly to avoid overlap between the table and objects below. | 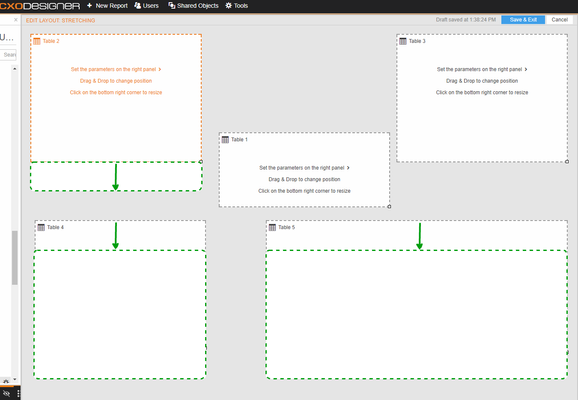 |
Colaboration & Workflow
System AnnouncementsWith the new System Announcements it’s now easy for admins to make updates or inform the whole organisation instantly, making company-wide communication easier and more efficient. The option in the designer is renamed from News Items into System Announcements. | 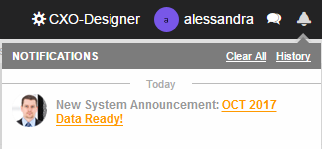 |
Dynamic HyperlinksGet the freedom to quickly access external information when needed. With an integrated hyperlink in your reports, internal or external links are now just a click away. | 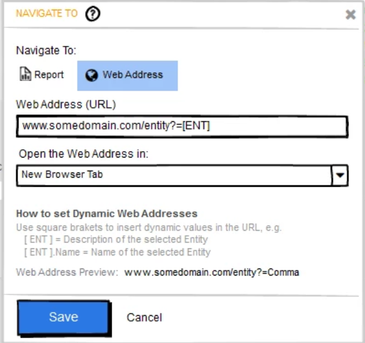 |
Other Improvements
Extended Variance Settings: Variance Threshold
Linked Cube Calculations: Linked Cube Calculations
'Navigate To' from Columns: Columns List
Image Control: Image Control
Check Settings: Check Settings
Bugs solved in this release:
Critical:
- DEV-12889 - Bridge data labels overlap category axis labels
- DEV-11619 - The Variance Trend arrow points in wrong direction
- DEV-11051 - Check for removing dimension mapping does not take into account source
Major:
- DEV-12735 - Storyboard viewer can delete / edit storyboard
- DEV-12451 - @Base is not working in scripted storyboards
- DEV-12280 - Combination of NEWLINE with redirect in columns does not work
- DEV-12016 - @@CUR(XXX) case sensitive in cube calculations / mdx lists
- DEV-11821 - Data label x-axes show empty lines
- DEV-11715 - Excel export: line breaks where there are commas
- DEV-11506 - Wrong format for conversations with the comment box on the right side
- DEV-11484 - Member selection dropdown in Data Load sheet does not show complete member names nor tooltip
- DEV-11483 - Numbers recognised as phone number and showing underlined
- DEV-11049 - DWA is case sensitive
- DEV-11011 - Variables for all sources are cleared when dimension mapping is removed for 1 source
- DEV-10926 - Special characters are not allowed in scripted storyboards
- DEV-10925 - Create view is showing as option when create views is disabled
- DEV-10909 - "+" signs are not showing up on line item comments after refreshing
- DEV-10874 - Font size not changing with lines in bars and lines chart
Minor:
- DEV-12738 - Report titles not updated in menu
- DEV-11055 - Incorrect notification link in email