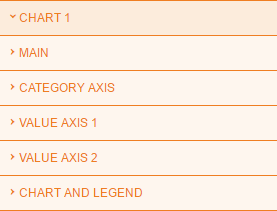
Bars & Lines Charts Control
Settings
The Report Settings define the look & feel and behavior of a report. Explanation regarding the General Settings, Point of View & Dimensions and Comments Settings can be found in Report Settings.
Every setting displayed in the table below occurs 6 times, so all settings as described configure 1 of the 6 charts.
Per chart several settings can be done see below.
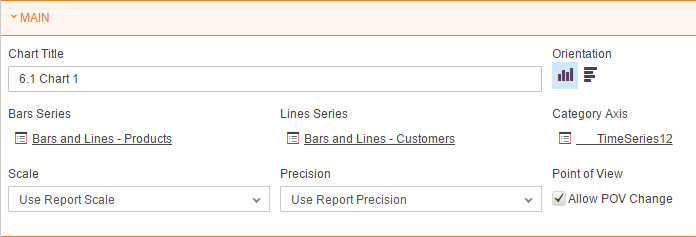
Main Settings
General setting will be done here. Set a title for the chart select a list.
Settings | Description | Mandatory |
|---|---|---|
| Chart Title | The Title of the Chart | No |
| Orientation | Decide in what position the bars are showed. | Yes |
Bars Series | A Lists that defines the bars part of the chart. Check the Chart Bar Style article for formatting options. | No |
Lines Series | A Lists that defines the lines of the chart. Check the Chart Line Style, Chart Dash Style and Chart Shape Style articles for formatting options. | No |
Category Axis | A list that defines the items for the X Axis. This list typically exists of time dimensions like year and period, but other dimensions can also be used. | Yes |
| Scale | This defines the scaling used in the report. Options are: Unchanged (no scaling), Thousands, Millions, Billions, Percentage. The last option multiplies the amount by 100 to show for example an amount of 0.75 from the source as '75%' in the CXO-Cockpit. The scale setting is the default for all data in the report, but can be overruled by a specific (non-default) scaling in the Member List. | Yes |
| Precision | This defines the number of decimals used for presenting the number. Options are 0-12. Similar to the Scale setting, the Precision setting is the default for all data in the report, but can be overruled by a specific (not -1) precision in the Member list. |
Category Axis
Several settings can be done such as setting a Axis title with a format. Determine the position of the labels including a format. The option to now show the labels is also possible.
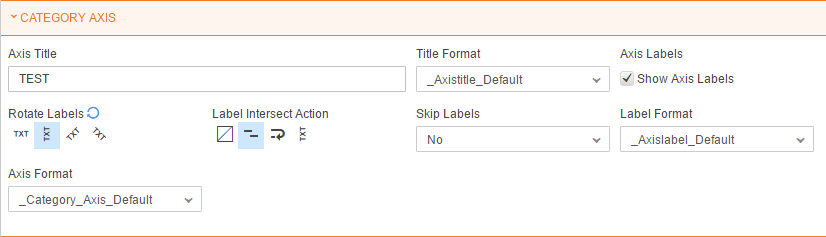
| Settings | Description | Mandatory |
|---|---|---|
Chart X Axis Title | The title to be displayed vertically next to the y axis | No |
Chart Right Y Axis Title | The title to be displayed vertically next to the second y axis on the right of the chart | No |
| Chart Axis Title Format | This settings allows you to choose the format for the title | Yes |
| Chart Axis Labels Format | This settings allows you to chosse the Labels format | Yes |
| Chart Axis Format | This settings allows you to chosse the format for the Axis | |
Chart Rotate Labels | This setting allows you to rotate the labels clockwise, counterclockwise, horizontally or vertically | Yes |
Chart Labels Intersect Action | This setting determines what action should be taken when Labels intersect: apply multiple rows, rotate or wrap | Yes |
Skip Labels | This setting allows you to skip labels | No |
Value Axis 1/2
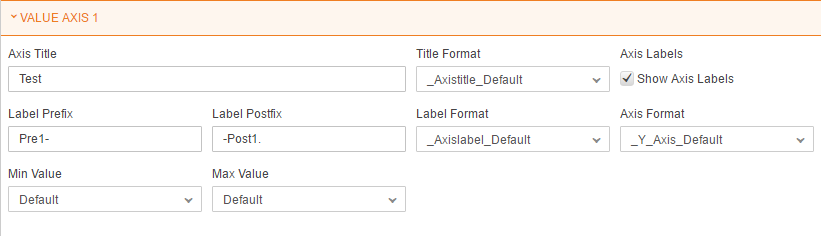
| Settings | Description | Mandatory |
|---|---|---|
Chart Y Axis Title | The title to be displayed vertically next to the y axis | No |
| Chart Title Format | This settings allows you to choose the format for the title | Yes |
| Chart Labels Format | This settings allows you to choose the Labels format | Yes |
| Chart Axis Format | This settings allows you to chosse the format for the Axis | Yes |
| Chart Axis Labels Prefix | A symbol that can be included at the beginning of the Axis Label | No |
| Chart Axis Labels Postfix | A symbol that can be included at the end of the Axis Label | No |
| Min Value | Set a value where the chart starts | No |
Max Value | Set a value where the chart ends | No |
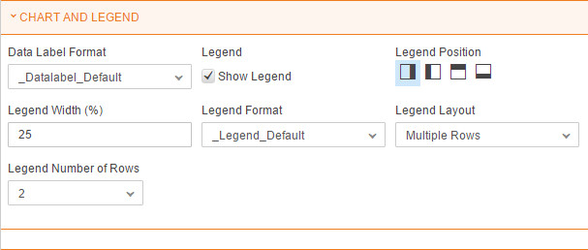
Chart and Legend
| Settings | Description | Mandatory |
|---|---|---|
| Chart Data label format | Set a format for the data in the chart | Yes |
| Chart Show Legend | The zoom setting defines if the chart y axis should be zoomed. If you select no the y axis will always start at 0 or lower | Yes |
| Chart Legend Position | Choose the position of the chart legend (e.g. Bottom, Right, etc.) | No |
| Chart Legend Width | Specify the legend size which is the percentage of the chart size. This setting will be ignored if Legend Position is set to Do not show | No |
| Chart Legend Format | Set a format for the legend | |
| Chart Legend Layout | Setting of how the legend should be showed | Yes |
| Chart Legend Number of Rows | How many rows the legend should show |
Common
| Settings | Description | Mandatory |
|---|---|---|
| Scale | This defines the scaling used in the report. Options are: Unchanged (no scaling), Thousands, Millions, Billions, Percentage. The last option multiplies the amount by 100 to show for example an amount of 0.75 from the source as '75%' in the CXO-Cockpit. The scale setting is the default for all data in the report, but can be overruled by a specific (non-default) scaling in the Member List. | Yes |
| Precision | This defines the number of decimals used for presenting the number. Options are 0-12. Similar to the Scale setting, the Precision setting is the default for all data in the report, but can be overruled by a specific (not -1) precision in the Member list. | Yes |
| Frequency | This defines the frequency of the report. Options are M (Monthly), Q (Quarterly) , Y (Yearly) or Any (user select). The frequency setting also impacts the options in the Point of View: Upon selecting M, the user can only select the Months. If you select Q, the user can only select Quarters. Selecting Any (user select) will allow the user to select either a Month, Quarter or Year from the Point Of View as required. | Yes |
| Palette | Color Palette allows you to customize colors displayed in a report | Yes |
| Left Footer Text | Enter a text that will appear in the lower left part of the report. This is dynamic label where you can use dimension values like [VAL] or one or more of the listed static indicators. | Yes |