Bridge Control

Content Settings
Settings
| Description | Mandatory |
|---|---|---|
| Begin and End | Select a List containing the Dimension-Members for the Start/Reference and the End/Base of the Bridge (e.g. Budget and Actual) | Yes |
Calculate Movements | Specify if the movement of the bridge should be calculated .When the movements are not calculated the values shown will be retrieved from the data | Yes |
| Movements | Select a List which contains the Bridge movement values for the calculation of the Movements that explain the difference between Base and Reference (e.g., Child-Entities, Products, Sub-Accounts). The Movements-list can also be a dynamic list. The sum of the Movements (Main Entity, Product Group, Main Account) should be specified in the Dimension Settings of the Report or in an Item Selector connected to the Bridge to insure the movements equal the difference between Base and Reference. | Yes |
Labels, Formats and Colors Settings
Settings | Description | Mandatory |
|---|---|---|
Title | Title of the Bridge | No |
Label Difference | In a Bridge chart, the sum of the movements or variance components sometimes do not exactly explain the difference between the current period and a previous period or between Actual and Budget (e.g., due to Intercompany transactions). The remainder is put in an Other category. With this parameter we can label this Other category. | Yes |
Labels Format | Select the format for the axis labels can be chosen from the /wiki/spaces/CXO61/pages/76710056 list | Yes |
Data Label Format | A format for the data labels can be chosen from the /wiki/spaces/CXO61/pages/76710056 list | Yes |
| Labels Intersect Action | Select an action to be done in order to prevent overlapping of the X-axis labels (MultipleRows, None, Rotate, Wrap). | Yes |
Rotate Labels | If Labels Intersect Action is set to Rotate, then select the desired orientation for the labels. | Yes |
Scale | This defines the /wiki/spaces/CXO61/pages/76710065 used in the report. It can be overruled by the scaling in the Lists. | Yes |
Precision | Defines the number of decimals used for presenting the number. Options are 0-6. Similar to the Scale setting, The Precision setting is the default for all data in the report, but can be overruled by a specific (not -1) precision in the List. | Yes |
Variance Settings
Settings | Description | Mandatory |
|---|---|---|
Use Variance Coloring | Use different colors for positive and negative movements | No |
Breakdown Sorting | Allows the control and sort sequence of variances. Select the appropriate option from the predefined list. | Yes |
Other Settings
| Settings | Description | Mandatory |
|---|---|---|
Zoomed View | Select Yes if you want to open the report in a zoomed view. | Yes |
Show Gridlines | Select Yes if you want to show Gridlines. | Yes |
Orientation | Select Horizontal (Bridge item labels on X-axis) or Vertical (Bridge item labels on Y-axis). | Yes |
Show Other | Show the "Other" Movements explained in 5. Label Difference or not | Yes |
Hide Y axis | Set to Yes if you do not want Y axis numbers to be displayed on the chart | Yes |
Allow POV Change | Specify if you want to allow the clicks in the chart or table to change the POV. This setting will be ignored if you don't enable the clickable charts or rows. | Yes |
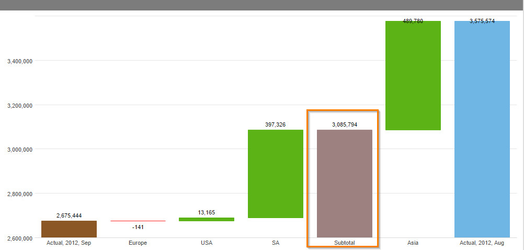
Subtotals in Bridge
There is the option to create a subtotal in the bridge.
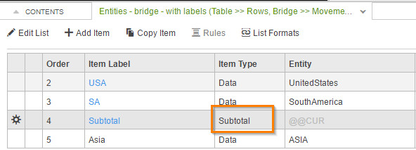
Set the Item Type in the movement list to Subtotal
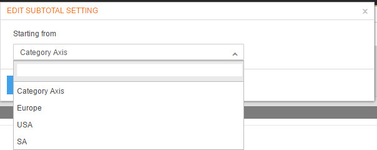
Next thing is to set the start of the subtotal to determine where the bar of the bridge should start counting of.