![]()
Over the years, we’ve worked hard to provide our customers with standardized reporting solutions, and to drive collaboration between different users and reporting teams. Every new CXO Software customer receives 18 standard dashboard templates as part of their licensing package, which we have created based on the best reporting practices of selected users around the world.
...
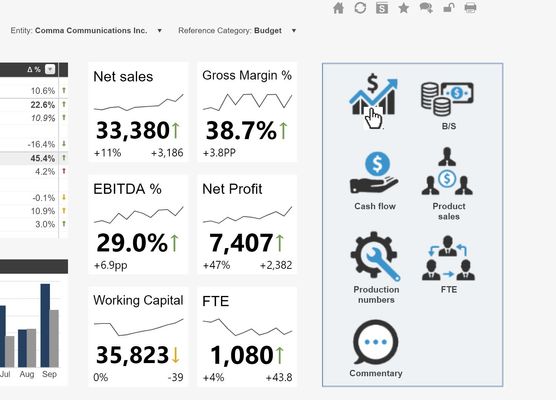
Navigate to function for Image controlWe see that redirects are often being used in our application, but redirects only worked with text. In version 6.4 we introduce redirects that work with images. Simply click on an image and you are redirected to another report or URL. This way we want to make the navigation inside CXO easier!. |
|
Donut ChartsWe already have the Pie chart control and we have extended that function with the option to create a donutDonut chart. Especially when you want to focus on a specific number in your Pie chart, you can use the donut Donut chart option to display the number in the middle of your donutDonut. | 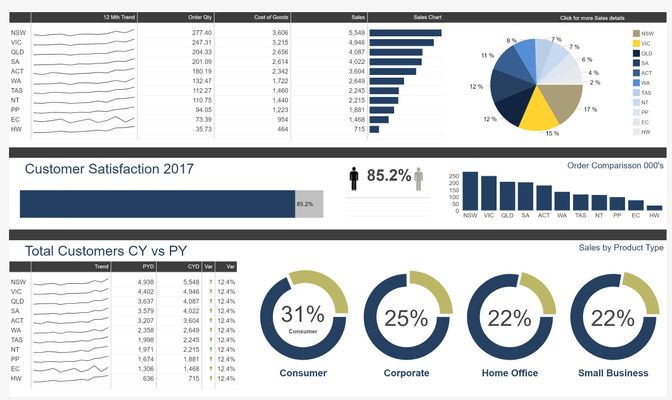 |
Variances in Bars and Lines ChartWe missed the option to show variances as positive / negative colors in Charts. But not anymore in version 6.4! The Variance formula that you normally could only use in tables, can now also be used in charts. Variances can be displayed as bars or as fill area! | 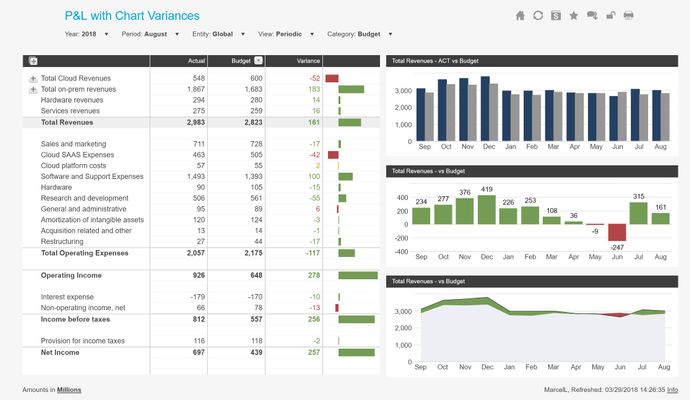 |
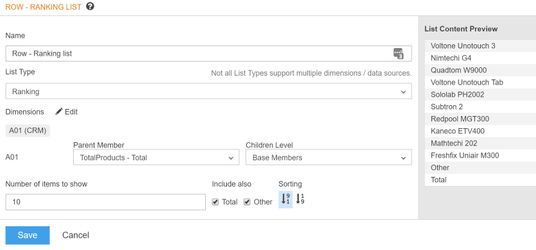
Ranking listsIn this version we also introduce a new list type: Ranking lists. In CXO you can create rankings with MDX lists, but that is often not that easy as you have to know how to write the MDX script. With Ranking lists we now make ranking accessible for all report builders. |
|
...