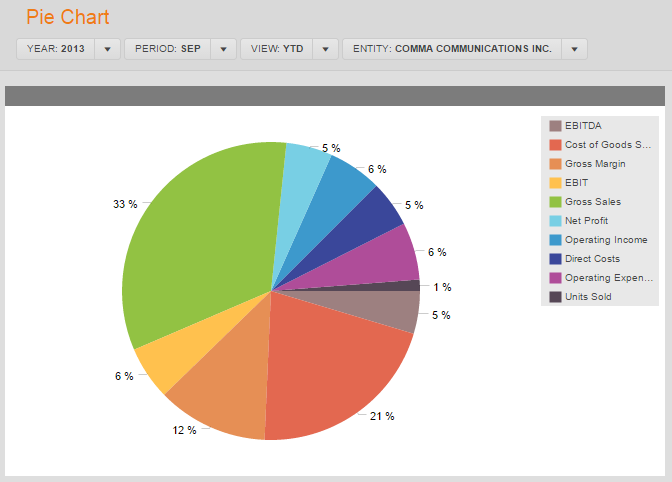
Pie / Donut Chart Control
Settings
The report settings define the look & feel and behaviour of a report.
Content Settings
| Settings | Description | Mandatory |
|---|---|---|
| Pie Source | Select The Lists containing the Pie Sections. | Yes |
Exploded Item | /wiki/spaces/CXO64/pages/625869218 that will show up as a highlighted section of the Pie. | No |
Total Item | Select the /wiki/spaces/CXO64/pages/625869218 that represents the total of the Pie Chart | No |
Labels, Formats and Colors Settings
Settings | Description | Mandatory |
|---|---|---|
| Title | Title of the Pie Chart Control | No |
Label Difference | In a Pie chart, sometimes not everything fits in the available Pie sections. With this parameter we can label this "Other" category. | No |
Pie Data Labels | Choose if and what Data Label you would like to show. (None, Percentage or Values) | Yes |
Data Labels Format | A format for the Data Labels can be chosen from the /wiki/spaces/CXO64/pages/625868903 list | No |
| Central Value | DONUT CHART ONLY: Show value in the center of the donut. Options are: None, Exploded item (value), Exploded item (%), Total value. | No |
| Central Value Format | DONUT CHART ONLY: The format used for the center format data number | No |
| Central Label | DONUT CHART ONLY: Enter a description in the center to the Donut (for the exploded item e.g.). | No |
| Central Label Format | DONUT CHART ONLY: The format used for the center format label. | No |
Scale | This defines the /wiki/spaces/CXO64/pages/625869165 used in the report. It can be overruled by the scaling in the Lists. | Yes |
Precision | Defines the number of decimals used for presenting the number. Options are 0-6. Similar to the Scale setting, The Precision setting is the default for all data in the report, but can be overruled by a specific (not -1) precision in the List. | Yes |
Layout Settings
| Settings | Description | Mandatory |
|---|---|---|
Top X | Show only top X items in the pie. The value can be absolute or percentage. For example, Top 10 will show only top 10 values, Top 90% will show top 90% of the total | No |
Show Ticks | Choose to show Ticks on the Surface of the Pie Chart or not. | Yes |
Pie Radius | With this parameter you can define the Pie's radius in number of pixels. When you choose "0" it will size automatically | No |
| Pie Sorting | Sorting of the Pie-Sections (Ascending, Descending, etc.). | Yes |
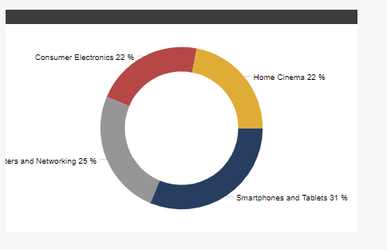
| Donut Chart | Enable the Donut view for the Pie chart |
Other Settings
| Settings | Description | Mandatory |
|---|---|---|
Allow POV Changes | Specify if you want to allow the clicks in the chart or table to change the POV. This setting will be ignored if you don't enable clickable charts or rows. | Yes |
Pie Legend Position | Select if and where to show the legend. | No |
Legend Size | Specify the legend size which is the percentage of the chart size. This setting will be ignored if Legend Position is set to Do Not Show. | No |
Legend Rows Count | Amount of rows available to display the legend. (Only available if Top or Bottom Legend Position is chosen). | Yes |