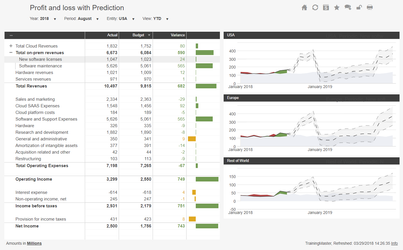
Variance Bar and Line chart
Introduction
Allow to show variance in charts with colored areas (red / green) marking the difference between the 2 series to be compared
Functional Requirements
The following table shows how the overall user story is subdivided into smaller sub user stories, which are detailed below.
# | Title | User Story | JIRA Story | MoSCoW * |
|---|---|---|---|---|
| 1 | Show Variance in Charts as difference-area | As a Report Builder / Report Admin I want to show variance in charts as difference-area in order to get to the desired visual result with no need to use cube calculations | ||
| 2 | Show Variance in Charts as red/green bars | As a Report Builder / Report Admin I want to show variance in charts as green/red bars/columns in order to get to the desired visual result with no need to use cube calculations |